Open topic with navigation
Viewing Gene Lists
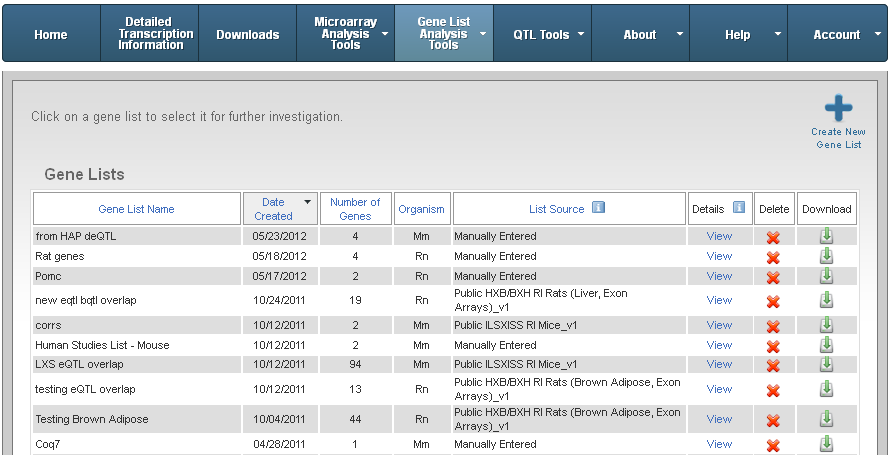
You can view and work with gene lists.
- Choose Genes List Analysis Tools in the main menu.
- Click Analyze a gene list. A page displays the gene lists to
which you have access.
 Note: You can only view gene lists that you have created
or to which you have been granted access. See "Sharing a Gene List".
Note: You can only view gene lists that you have created
or to which you have been granted access. See "Sharing a Gene List".
You can:
- Click the Create
New Gene List button to upload or manually create
a new gene list.
- Click the View
link in the Details column to
view gene
list details. See "Viewing Gene List Details" for more
information.
- Click on a row to view
the gene list.
- Click the Delete
icon
 to delete a gene list.
- Click the Download
icon
 to download a gene list.
When you click a gene list, the following
tabs display details for that gene list:
- List:
Shows the list of genes in the selected gene list.
- Annotation:Allows you to perform annotation on a gene list.
- Location (eQTL):
Allows you to view the physical location and transcriptional control
locations (eQTL) of your genes on an interactive chromosome map.
- Literature:
Allows you to perform a literature search for a gene list
- Promoter: Allows you to run promoter analysis using oPOSSUM, MEME or Upstream Sequence
Extraction on a gene list.
- Homologs:
Allows you to obtain information regarding chromosomal location in other
genomes.
- Pathways: Allows you to analyze the hypothetical impact of differences
in transcription levels of a set of genes on signaling pathways defined
by KEGG (Ogata et al 1999). The Pathways tab only displays when a full change or correlation coefficient is available.
- Analysis
Statistics: - Allows you to view the raw p-values and the adjusted
p-values from the statistical analysis performed to generate this gene
list. Depending on the number of groups and the type of analysis used,
it may also display group means, F-statistic, mean intensity, correlation
coefficient, difference in log base 2 intensity, t-statistic, or parameter
estimates. The Analysis Statistics tab only displays if the gene list was created by running an experiment; it contains the statistics related to that analysis.
- Expression
Values: Allows you to view normalized expression values of your
genes in any data set.
- Exon Correlations: Allows you to an create an exon correlation heatmap for a specific gene, species, and tissue.
- Save
As: Allows you to save gene lists translated to other types of
identifiers.
- Compare:
Allows you to compare gene lists, with the option to create, for example,
unions or intersections of the gene identifiers.
- Share:
Allows you to view users who have access to a gene list and to give
permission to other users to access your gene list.
See Also
Annotating Gene Lists
Viewing Location and eQTL
Performing a Literature Search
Using Promoter Options
Viewing Homologs
Viewing Pathways
Viewing Analysis Statistics
Viewing Expression Values
Viewing Exon Correlations
Saving a Gene List As Other Identifiers
Comparing Gene Lists
Sharing a Gene List
 Take a look