Open topic with navigation
Viewing Location and eQTL
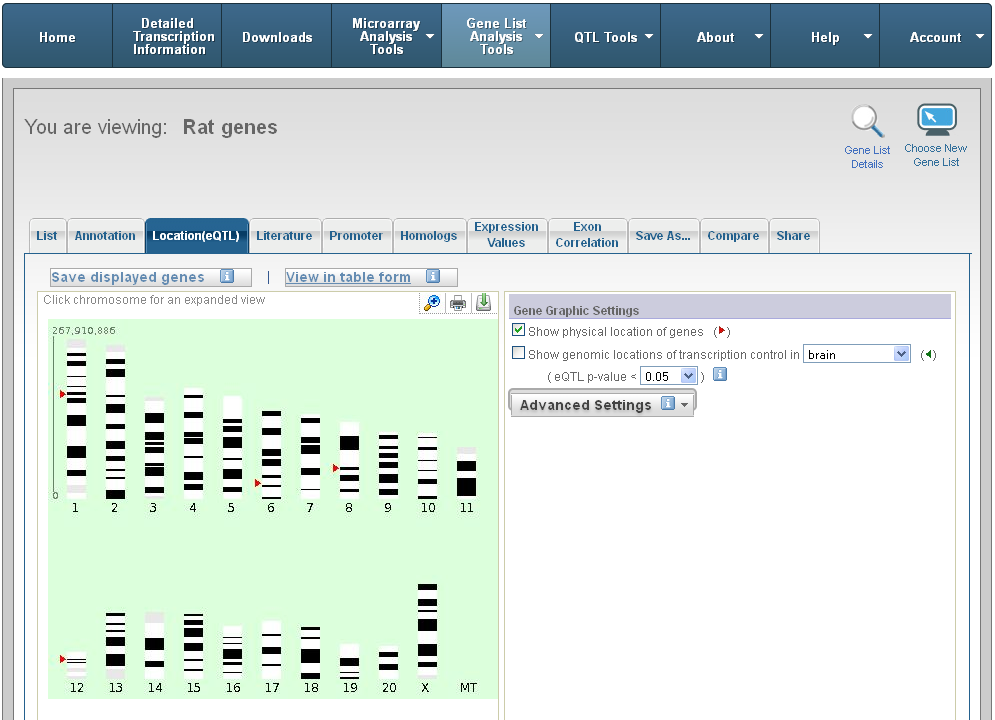
The location graphic allows you
to investigate and use expression QTL (eQTL) datasets. By default, only
the physical locations are shown on the graphic. You can click the "Show
locations of transcription control in brain" check box to display
the locations of transcription control. These green arrows represent the
genomic position(s) that control transcription of the candidate genes
in the gene list (expression QTLs, or eQTLs).You can also change the significance
level for displaying eQTLs
You can view the location and
eQTL data for a gene list in two ways:
Gene List Analysis Tools
- Choose Genes List Analysis Tools in the main menu.
- Click Analyze a gene list. A page displays the gene lists to
which you have access.
- Click
the gene list for which you want to view location and eQTL.
- Click
the Location (eQTL) tab. The Location
page displays.
QTL Tools:
- Choose QTL Tools in the main menu.
- Click View
physical location and eQTL information about specific genes from a gene list. A page displays the gene lists to which you have access.
- Click the gene list
for which you want to view location and eQTL. The Location
and eQTL page displays.
The data on the page looks the same, regardless of the way you access
the page. You can:
- Click the View
in table form link to see a table of all of the genes currently
displayed on the graphic. If any of the probe sets for a given gene have
a significant eQTL, all of the probe sets for that gene are displayed in
the table, but only the most significant eQTL position ("Max LOD")
and the associated marker locations are shown on the graphic.
- Click the
View link in the gene table to
display individual LOD plots for each probe set. Copy these by right-clicking
on the image.
- Click the
Download button to download the
table into a tab-delimited text file.
- Click the
Customize this view button to
change the default view of the table, which includes all probe sets for
a given gene.
- Choose Genes
(and all associated probesets) from the [selected] list that meet the
restriction criteria to restrict the list to those with eQTLs (probe sets)
that overlap the selected bQTL intervals.
- Select Probesets
that are in the [selected] gene list to restrict the list to probe sets
(as opposed to genes) whose expression values are significantly correlated
with the phenotype. These probe sets are also identified by the asterisk
in the first column of the table.
- Selelct Probesets
that have eQTL p-value < [selected value] to restrict the list
to only the probe sets passing the desired threshold.
- Choose Genes
(and all associated probesets) from the [selected] list with probesets
that did not meet the restriction criteria or were not considered in eQTL
to restrict the list to those that were not considered in eQTL.
- Click the Download
icon
 to download the chromosome map as a JPEG graphic.
- Click the Save
displayed genes link to save the displayed genes as a gene list.
- Click the Magnify
 icon in the graphic to expand the graphic to the full
page.
icon in the graphic to expand the graphic to the full
page.
- Click a chromosome in the
graphic to show an expanded view. See "Expanded Chromosomal View".
- Set the Gene
Graphic Settings:
- Show
physical location of genes - Choose this option to mark the physical
location of genes with a red arrow.
- Show genomic
locations of transcription control in...Choose this option
to mark the transcription control locations with a green arrow, and choose
a corresponding eQTL p-value. For mouse, only brain is available. For rat, options are brain, heart, liver, and brown adipose.
- Click Advanced
Settings to enter user-defined regions, such as QTLs. You can also:
- Click View to see details about the specific
region.
- Click the
Delete icon
 beside
the region you want to delete.
beside
the region you want to delete.
Expanded Chromosomal View
The expanded chromosomal view zooms in on the specific location you
choose in the graphic, shows the zoom location, and allows you to set
basepair start (left) and end (right) positions.
 Take a look