You can create an exon correlation heatmap for a specific gene, species, and tissue. The data is retrieved from multiple databases, so generating the initial graphics may take a few moments.You can display the heatmaps for two transcripts of a gene side-by-side to determine the transcript that best fits the expression correlation patterns.
Gene List Analysis Tools
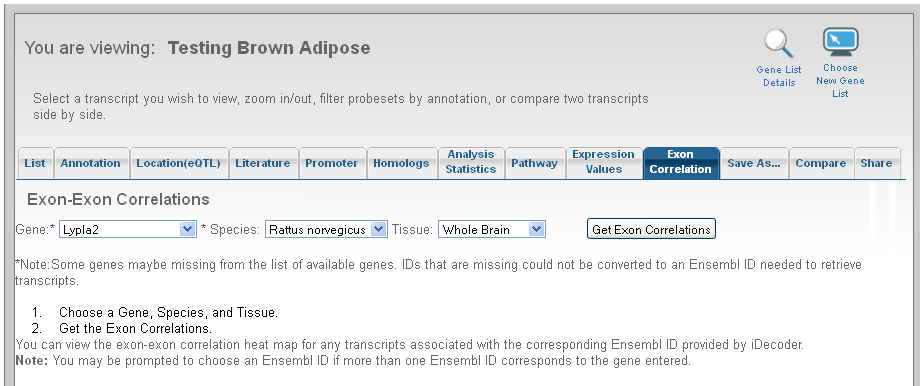
On the Exon-Exon Correlations page:
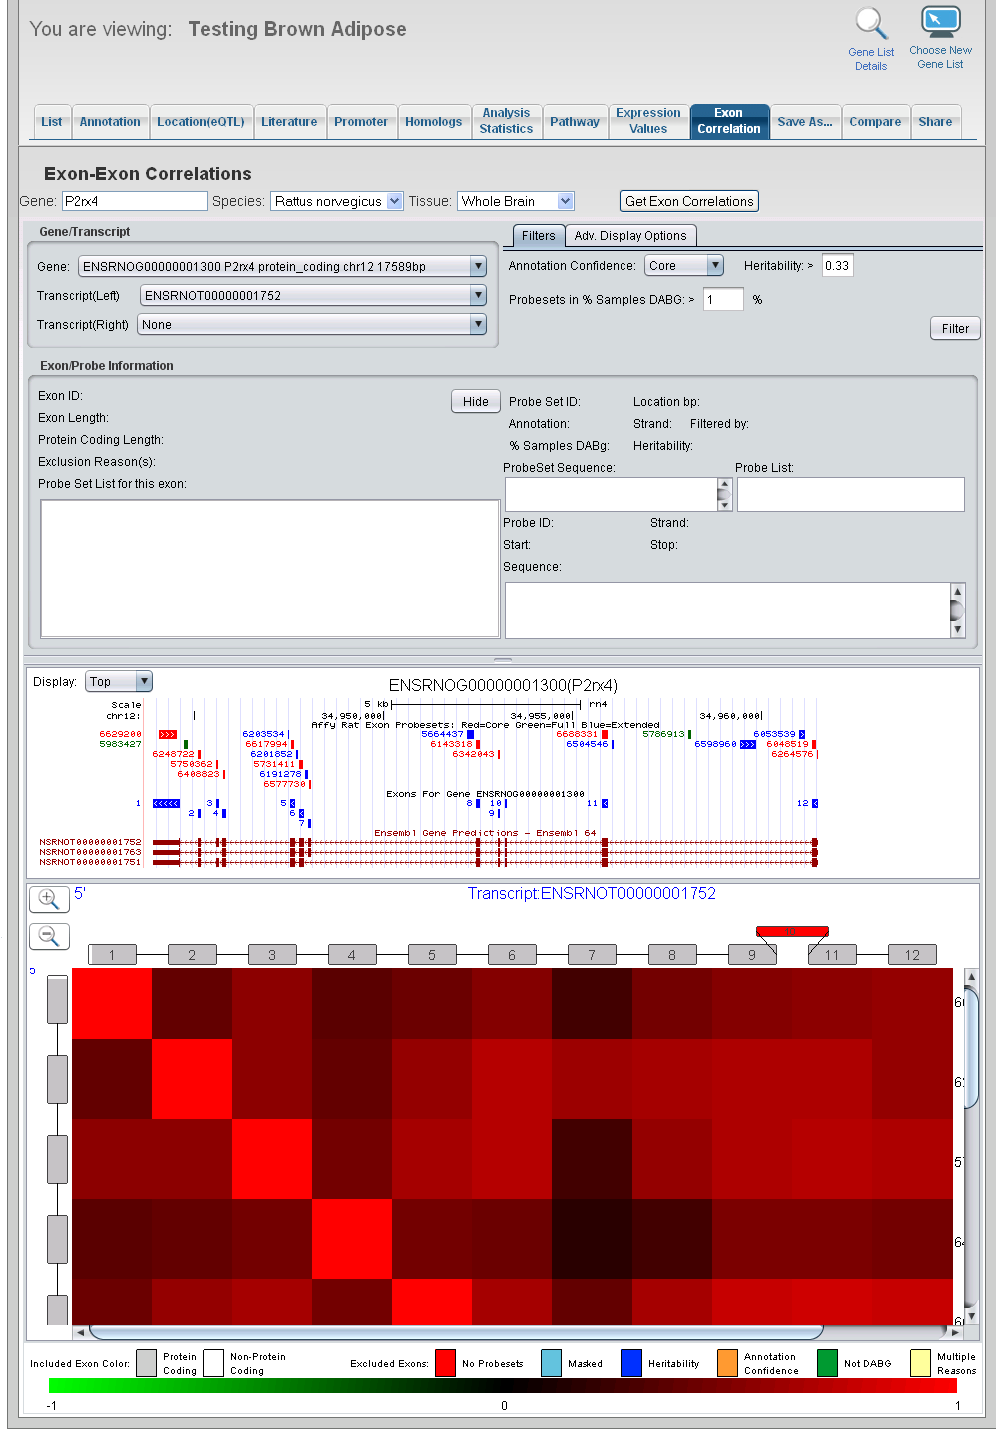
By default, the first graphic, which is generated through the University of California Santa Cruz Genome Browser (http://genome.ucsc.edu/), displays the probe sets from the exon array and the annotated Ensembl transcripts (i.e., isoforms) for the input gene.
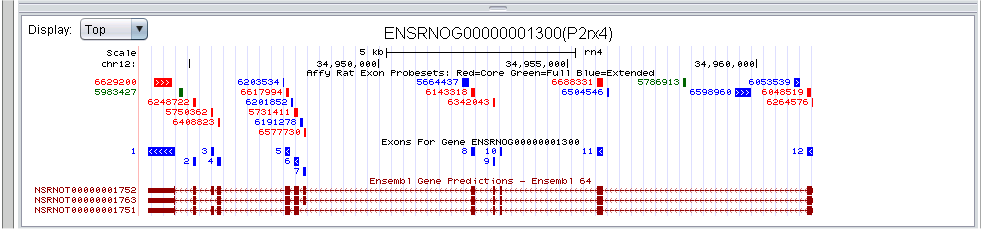
The exons are color-coded based on their level of annotation according to Affymetrix. The red probe sets are included in the core set of probe sets and indicate high confidence in the annotation. The blue probe sets are included in the extended set of probe sets according to Affymetrix, and the green probe sets are from the full set of probe sets and indicate the least amount of confidence in the annotation. The next track assigns a number to each annotated exon of the gene to aid in interpretation of the heatmap that follows.
By default, the second graphic is a heatmap that displays the correlations among exons of a given transcript of the gene.

Each row and column represents a probe set that passed the filtering criteria specified at the top right side of the page. Along the top of the heatmap is a schematic of the exon structure of the transcript. The boxes represent exons of the transcript and are numbered, as in the top figure. Grey boxes are exons that are probed by the array, met the filtering criteria, and are displayed in the heatmap. Exons that do not satisfy these criteria are colored based on the reason why they are not included in the heatmap.
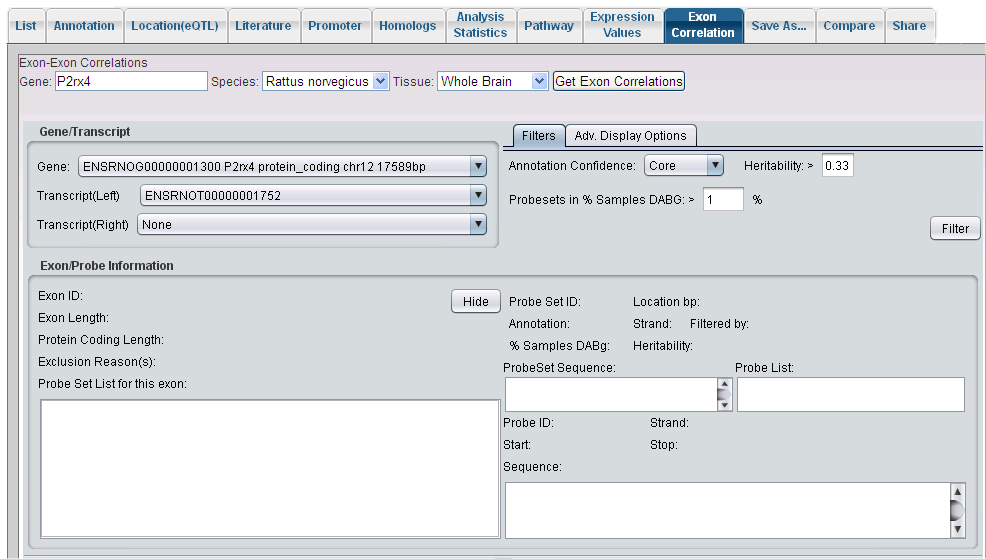
In the top right section, choose the probe sets to display for the heatmap based on the:
Choose the Adv. Display Options tab to show advanced display options that allow you to include probe sets that align to an intronic region of the gene or align to the opposite strand from which the gene is coded.
 Take a look