Signaling Pathway Impact Analysis (SPIA) is a tool for analyzing the hypothetical impact of differences in transcription levels of a set of genes on signaling pathways defined by KEGG (Ogata et al 1999). The input is a set of gene identifiers and their fold changes. The Pathways tab only displays when a full change or correlation coefficient is available.
The influence of differences in transcription of the input gene set on a particular pathway is assessed using two measures:
For each pathway, a p-value is calculated for each of these measures. PNDE is the p-value associated with an enrichment test (i.e., is the number of differentially expressed genes in the given pathway more than one would expected by chance). The values for PNDE are calculated using the assumption that NDE follows a hyper-geometric distribution.
The second probability, PPERT, is calculated based on the estimated amount of perturbation in each pathway due to the differential expression of the input genet set. Each pathway is represented as a network, with genes/proteins for nodes and directed edges indicating interactions between them. The perturbation of the pathway caused by each gene/protein is calculated using the number of genes/proteins it influences (either activates or suppresses) and its magnitude of change.
SPIA takes a table of differentially expressed genes and their fold changes as input and returns a table of signaling pathways containing at least one of the genes on the list. This table summarizes the impact of the differentially expressed genes on each pathway and contains links to images from the KEGG pathways site and to other summary information.
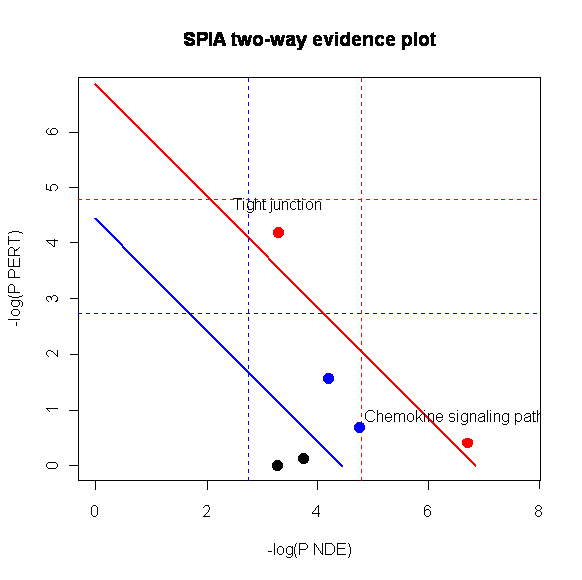
The output also includes a summary plot, where each pathway containing at least one gene from the input list is plotted to its (-log transformed) values for PNDE and PPERT. The plot indicates where the most impacted pathways lie, with respect to two statistical thresholds. The first is the family-wise error rate, indicated by the solid red line in the plot. The second is the false discovery rate, indicated by the solid blue line in the plot.
 Take a look